Data as a Tool for Housing Justice: Analyzing Hartford Housing Code Cases from 2011-2021
Data as a Tool for Housing Justice: Analyzing Hartford Housing Code Cases from 2011-2021
Myrian Ayala ‘25, James Maciel-Andrews ‘25, Jack White ‘25, and Anna Grant-Bolton ‘25
With community partner Juan Fonseca Tapia, Center for Leadership & Justice
Areas for Further Investigation
Introduction
In 2017, the Center for Leadership and Justice (CLJ) launched the #NoMoreSlumLords campaign to bring national attention to reprehensible tenant living conditions in particular Hartford apartment buildings owned by absentee landlords. The Center for Leadership and Justice (CLJ) is a nonprofit organization engaged in broad-based community organizing with the goal of building relational power to bring about systemic justice in the Greater Hartford area. After 2 years of agitating for justice, the CLJ’s #NoMoreSlumlords campaign successfully advocated for the passage of revisions to the Hartford Housing Code. Despite this victory, many Hartford tenants continue to live in exploitative housing conditions with insufficient government support due to negligence by landlords and housing code enforcement challenges.
Hartford community members have shared their stories of contaminated water and rodent infestations, among other unsafe housing conditions. The Hartford Housing Authority is extremely understaffed (with the number of housing inspectors cut from 14 to 6 over the past two decades), resulting in significant numbers of unresolved Housing Code complaints and extended wait times for those whose complaints are investigated. This means that residents who experience Housing Code violations are often left with little government support while exploitative landlords are not held accountable. Creating a more equitable housing system requires developing a more responsive Housing Code case resolution system and organizing tenant power to challenge structural economic barriers to safe housing.
Our Project
Given this situation, the Center for Leadership and Justice (CLJ) is currently designing a Housing Campaign to support the implementation of the revised Housing Code that was approved in 2019. The campaign has three main goals: 1) ensure that the language of the CLJ’s approved Housing Code proposal has not been altered drastically since its adoption in 2019; 2) verify that the recently amended Housing Code is actively and accurately implemented citywide; and 3) establish and maintain a reliable system of citizen-led housing accountability. Therefore, as students from the Community Action Gateway Program at Trinity College, we are thrilled to collaborate with the CLJ to provide research and communications products that contribute to the campaign’s second goal listed above.
Methods
Hartford housing code cases provide valuable insight into the state of housing conditions in Hartford. When Hartford residents experience unsafe, dangerous, or inadequate housing conditions, they can submit a housing code complaint to the Hartford Housing Authority. Once they have submitted their complaint, the Hartford Housing Authority is responsible for inspecting the property. If the inspector finds that there are dangerous, unsafe, or inadequate housing conditions that are not caused by the tenant, landlords can be held accountable by law and/or forced to improve conditions. Therefore, Hartford housing code cases are not only a measure of housing conditions in Hartford, but an act of resistance from tenants to demand safe and livable housing conditions.
In utilizing our research and communication skills, we used the publicly available Housing Code Cases 2011- Present data set to answer the below questions, which we believe will be extremely valuable in advancing the Center for Leadership and Justice’s housing campaign:
- What are the locations of currently open Housing Code Cases?
- On average, how many Housing Code Cases were opened per year since 2011?
- How has the length of time taken to resolve a housing code case changed between 2011 and 2021? Is there a relationship between average time taken to resolve housing code cases and the number of housing inspectors employed?
- How has the number and proportion of unresolved housing code cases changed since 2011?
To answer these questions, we worked as a team to export, clean, analyze and then visualize publicly available data on the Hartford housing code cases.
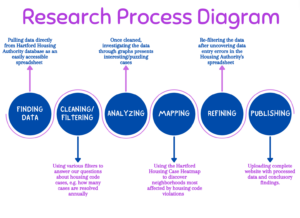
We began by viewing Hartford’s public data on housing code cases on HartfordData. We exported this data to Google Sheets, where we created several filters to sort the data by several relative criteria. Depending on the data question, we used the filter feature to refine data by year and resolved data. In creating several combinations of different filters, we were able to create a spreadsheet of Hartford’s cleaned housing code cases data from the set of nearly 30,000 cases.
Additionally, we compared the FOIA request process in Connecticut to that of other Northeastern states to better understand barriers to accessing government information in the state of Connecticut. Our research questions are as follows:
What are the ordinances regarding FOIA in Connecticut and other Northeastern states?
What is the FOIA request process?
What are the fees associated with a FOIA request?
What is the mandatory response time for a FOIA request?
Who is allowed to submit a FOIA request?
Results
What are the locations of currently open housing code cases?
Created by Trinity Alumnus Ilya Ilyankou and Trinity Professor Jack Dougherty, the Housing Code Cases Heatmap (Figure 3 below) indicates the location of all Hartford housing code cases reported since January of 2011 and is automatically updated from the City of Hartford’s Socrata open data source, as well as Hartford’s parcel boundaries. The map shows clusters of cases as colored hotspots, where red shows the most cases in proximity to each other, and blue and gray indicate lower concentrations of housing cases in a neighborhood. At Zoom level 17, the user reads the data as a point map, viewing the individual geolocational point of each case, and by clicking on it, can determine important information such as an address, category of housing complaint, and date the case was opened. It is important to mention that the status of the data depends wholly on how recently the City of Hartford’s Socrata open data platform is updated, as this is where the map pulls all of its Housing Code data from. Click here for a link to the Housing Case Heat Map.
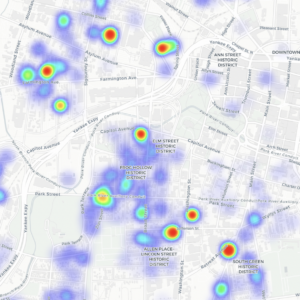
As visualized by the heat map above, Hartford housing code cases are not evenly distributed across the city. Several neighborhoods––and buildings––in Hartford have extremely high caseloads (as illustrated by red-orange hues on the heat map) relative to other Hartford communities. Specifically, Hartford’s North End, Frog Hollow district, and West Boulevard historic district have high concentrations of housing code cases. This data provides evidence that there are certain Hartford neighborhoods that are more likely to be affected by housing code violations than others. An alternative hypothesis, however, is that certain Hartford communities are better educated on the process of filing a housing code complaint. Regardless, the heat map identifies certain communities where housing code violations are present and numerous. For a base-building organization like the CLJ, this information can be used to find community members who are stakeholders in their housing justice campaign so that affected tenants can collectively mobilize to demand more just housing conditions.
On average, how many housing cases were opened per year since 2011?
As with our other data findings, we used the Hartford housing code case data to answer this research question. We began with the entire set of Hartford housing code cases between 2011 and 2021 downloaded onto Google Sheets. To find the yearly average number of housing code cases opened, we first had to identify how many housing code cases were opened in total between 2011 and 2021. To do this, we scrolled to the bottom of all of the data entries and typed in TOTAL in the A column of the first open row. We then clicked on the cell in the B column of the same row. Once this cell was selected, we entered the following function into the formula section at the top of the data: =SUBTOTAL(3, AX:AY), replacing X with the number of the first row of data (in our situation, 2) and Y with the number of the last row of data (in our situation, 29,559). When we clicked enter, the total number of housing cases opened between 2011 and 2021 appeared at the bottom of our data, in the cell to the right of “TOTAL”. An image of the process is inserted below:
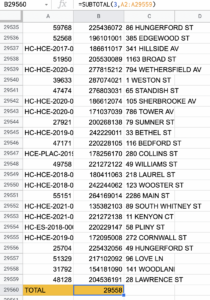
Once we found the total number of Hartford housing code cases opened between 2011 and 2021 (29,558), we simply divided it by the number of years between 2011 and 2021 (10) to get the average number of housing cases opened per year to be 2,956. Then, we divided the average number of cases opened per year (2,956) by the number of days in a year (365) to get the average number of housing code cases opened per day between 2011 and 2021 to be 8.1.
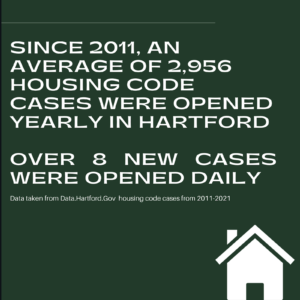
As illustrated by the graphic above, an average of over 2,956 housing code cases were opened yearly and over 8 housing code cases were opened daily in Hartford, Connecticut between 2011 and 2021. This data provides valuable information on the scope of housing code violations in Hartford. The city of Hartford has a population of 123,088 people. Thus, if the average number of Housing Code Cases opened yearly is 2,956 people, there is a housing code case for one out of every 42 Hartford residents yearly. This indicates that a significant proportion of Hartford residents are living in inadequate, unsafe, or dangerous housing conditions. It should also be taken into consideration that many housing code cases likely come from households with multiple people. Therefore, although only one housing code case may be filed for a property, more than one individual is being negatively impacted by the unsafe housing conditions. Moreover, it is important to acknowledge that not all housing code violations are reported. Finding and completing a government housing code case form may be too time-consuming or inaccessible for some families. Thus, it is highly likely that there are significantly more than 2,956 housing code violations in Hartford yearly. Lastly, it is critical to understand that multiple housing code complaints may be filed by the same individual. This is not to diminish the severity of the housing violations in Hartford––as multiple housing violations by the same individual would suggest they live with extensive housing code violations––but instead clarifies that although an average of 2,956 housing code cases were opened yearly, it is likely that less than 2,956 households filed housing code cases. Nonetheless, the average number of Hartford housing cases per year provides evidence of a striking and urgent housing crisis in Hartford.
How has the length of time taken to resolve a housing code case changed between 2011 and 2021? Is there a relationship between average time taken to resolve housing code cases and the number of housing inspectors employed?
Firstly, figure 6 displays the total cases registered every year (2011-2021), which includes cases that were closed as well as cases that were opened but have not been closed by the end of the calendar year. As can be seen from the graph, there was a significant spike in cases registered in 2014 in comparison to other years. This information is useful to contextualize average housing code case closure times, as higher caseloads would suggest longer inspection wait-times, with housing inspectors having far more inspections to complete.
Figure 6: An interactive graph showing the number of cases opened each year.
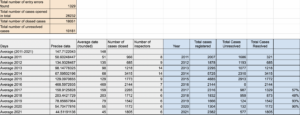
Obtaining the overall average time taken to resolve a housing code complaint (referred to as “housing case closure time” hereafter) from 2011-to 2021 would not provide us with a precise understanding of housing code inspection wait times since the average closure time varied significantly by year. Thus, we applied our data skills to obtain the average housing case closure time for each year. One of the variables that could have potentially influenced the average case resolution time is the number of housing inspectors in charge of resolving housing code cases for each particular year. To study this relationship, we graphed the number of city-employed housing inspectors per year alongside the average housing case closure time by year.
Figure 7 showcases all the cases that were opened and closed from 2011-2021. As illustrated, in 2014 there was a significant amount of housing code cases that were closed, with a total of 3,415. In contrast, there were only 685 cases closed in the year 2012, which is the lowest one among the 10 years of housing code cases registered.
Figure 7: An interactive graph showing the total number of cases registered by year.
Although in 2014 there were more open-closed cases, the next graph (figure 8), reveals that, on average, it took more time in 2016 to close an open housing case. As researchers, there are many questions that one can ask to explain this outlier. One of the factors that could have potentially influenced the average housing case closure time is the number of inspectors that were hired at a particular year. This is why we also created a change-over-time data visualization (figure 9) that showcases the number of staffing of housing inspectors hired by year.
Figure 8: An interactive graph showing the total number of Hartford housing code cases opened and closed within the calendar year between 2011 and 2021.
Figure 9: A graph demonstrating the number of housing inspectors employed by the city of Hartford between 2011 and 2021.
The two graphs provide additional information that is key to understanding why the average housing case closure time varies significantly between 2011 and 2021. During the peak housing case closure time (2016), Hartford only employed 7 inspectors, a mere half of the number of inspectors that were employed 2 years earlier. Moreover, in 2013 and 2014, when the number of housing inspectors was at its peak (14 inspectors), the housing case closure time was significantly shorter, at approximately 100 days (compared to upwards of 400 days in 2016), despite higher caseloads. This data provides evidence that the understaffing of housing code inspectors contributes to longer closure times. However, housing case closure time improved significantly between 2016 and 2021 despite the number of housing inspectors decreasing. This evidence suggests that the number of housing code inspectors is just one of multiple factors that influence the housing case closure time. It is important to emphasize that this is a correlational rather than a experimental study.
Limitation of the findings
Before filtering data per year, we found a total of 1,329 entry errors (4.5% of the entire data set) that were all removed. The most common entry errors across all years was the open and close date. For example, a closed date was entered at an earlier time than the open date, which gave us a negative number for the case closure time. Findings are not a hundred percent representative of all entries due to these errors. Moreover, when collecting the number of housing inspectors, we found one entry stating “system” instead of an inspector’s name. We did not include this entry.
Data source
The raw data of housing code cases was gathered from the City of Hartford open-source Database website. We downloaded the data in a .cvs format and uploaded it in a Google spreadsheet for sharing purposes among the CLJ team. Then, we proceeded to clean the data by deleting columns that would not be used for our analysis. We used the formula tools of google spreadsheet to calculate the average date, which was the following: =Days(end_date, start_date). This allowed us to see errors among the dataset, since we got many negative numbers (indicating a closure date listed as a time before the case opening date) when getting the difference. Next, we used the filtering tool to select the data for specific years. To do so, we selected the “open date” column, filtered by condition, and selected the option “is between” to add 01/01/201_ to 12/31/201_. Then we copied all the filtered data into new sheets to get the average for each year by using =average(H2:H_). To count the number of inspectors, we went to each sheet, organized by year, selected the filter, chose the “inspector first name,” deployed to see all the inspectors and counted them.
- City of Hartford, Socrata open data, Housing Code Cases: https://data.hartford.gov/Housing-Development/HousingCodeCases_01012011_Current/86ax-cfey
- Socrata open data repository for dates when “Data Last Updated” and “Metadata Last Updated”
- Hartford parcel boundaries, Capitol Region 2021: https://portal.ct.gov/OPM/IGPP/ORG/GIS2/Parcel-Data
How has the number of unresolved housing code cases changed since 2011?
Figure 10: A graph illustrating the number of unresolved Hartford housing code cases since 2011.
The data visualization above is a stacked bar graph that illustrates the change of the number of unresolved Hartford housing code cases between 2011 and 2021. Upon further investigation, the data presented here depicts a puzzling case, as it directly conflicts with the decrease in housing code inspectors, starting from 2015 onward. Even though the inspecting team from 2013 to 2016 was cut in half, housing cases reports showed complete resolution, before dipping below 50% from 2017-2018, and bobbing back up towards 90% from 2019-2020. This begs the question: Has there been an amendment of previous inspection policies that makes solving these housing code cases more efficient and methodical, or has the city made it more challenging for citizens to lodge complaints? Regardless, the increased number of housing code cases paired with a spike in the unresolved rate provides evidence that the enforcement of accountability measures (ie. housing inspections for housing code cases) for unjust housing code conditions has decreased since 2020.
How do Freedom of Information ordinances in Connecticut compare to those of other Northeastern states?
The Freedom of Information Act (FOIA) is a federal law in which public information can be requested by individuals. According to the U.S. Department of the Interior, Freedom of Information ordinances are “often described as the law that keeps citizens in the know about their government.” There are currently over 100 agencies where FOIA requests can be made. After the FOIA request is made, a letter will be sent to the requester that acknowledges the request. The response time that this letter must be sent out by varies from state to state. While there is no standard fee to make a FOIA request, fees can be applied for some instances. In a typical agency that accepts FOIA requests, there will generally be no fee for the first 2 hours of research in which records are searched, but fees can be waived on a situational basis. Congress acknowledges 9 exemptions to FOIA requests that can be found here: FOIA Exemptions.
Robust Freedom of Information laws are critical to ensuring government transparency in the United States. However, as aforementioned, Freedom of Information ordinances vary by state. To evaluate the strength of the FOIA process in Connecticut, we conducted research on Connecticut’s FOIA ordinances, as well as those of Massachusetts, New York, and Rhode Island (all states that neighbor Connecticut).
Our sub-research questions are as follows:
What is the FOIA request process?
What are the fees associated with a FOIA request?
What is the mandatory response time for a FOIA request?
Who is allowed to submit a FOIA request?
To complete the research table below, we searched public digital resources on the FOIA process in our selected states. We primarily drew information from government webpages (such as FOIA.gov or the United States Justice Department website) but also pulled information from non-government online sources (such as Ballotpedia).
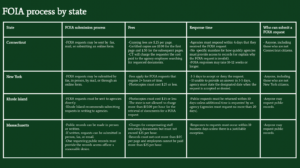
As illustrated in the table above, the Connecticut FOIA submission process is very similar to that of New York and Massachussts, with submission options including online, fax, and mail options. Moreover, in all 4 states researched, any resident may submit a FOIA request. As for fees, Connecticut, New York, Rhode Island, and Massachusetts charge the FOIA requester for 1) the wages paid to the employee that searches for documents and 2) the cost of photocopying the documents. However, Connecticut’s fees are slightly higher, as the state charges for all hours an employee spent searching (while New York does not charge if the request takes less than 2 hours), and does not state a maximum hourly wage the requestor would pay (as Rhode Island and Massachusetts do),
Most notably, however, Connecticut is the only state in the region that does not list a required response time for a FOIA request. While New York, Rhode Island, and Massachusetts all list mandatory response times between 3 and 10 days, FOIA requests in Connecticut can take upwards of 12 weeks. Connecticut’s lack of guidance on FOIA requests can lead to serious transparency issues for the public. Without a mandatory FOIA response time, agencies are able to significantly delay sharing critical information with the public. For residents seeking to hold government agencies accountable, information provided under the Freedom of Information Act may be central to identifying government issues and addressing them. Providing a clear and mandatory response time––as other neighboring states do––is central to promoting government transparency and accountability in Connecticut.
Areas for Further Investigation
While our research provides valuable insight into the scope and severity of housing code violations in Hartford, many research findings point us in the direction of new questions. Firstly, further research can be done to better understand the social, economic, and political forces that cause some Hartford communities to have higher concentrations of Hartford Housing Code cases than others. Understanding the conditions that create housing code issues is critical to identifying solutions that reduce housing injustice. Another avenue of further research is identifying the proportion of Hartford housing code violations that are reported. While reviewing and analyzing data on reported housing code cases is valuable in identifying patterns in data, understanding the breadth of Hartford’s housing code violations requires data on the total proportion of Hartford households that have one or more housing code violations. This research could be used to identify communities with high concentrations of housing code violations with few housing code cases, where education on how to submit a housing code case would be helpful. Lastly, further research should be done on the proportion of households who have submitted 2+ housing code complaints. This information would be valuable for two reasons. Firstly, it would identify households that have been the most impacted by housing code violations, whose members are key stakeholders for the CLJ’s housing justice campaign. Secondly, this research would demonstrate how many households have been impacted by housing code violations. Understanding the total number of households that have experienced at least one housing code violation is key to correctly evaluating the scope of housing code violations in the city of Hartford.
It should also be noted that while the heat map automatically updates all data posted to HartfordData’s Socrata platform, the HartfordData information on Hartford housing cases is not updated automatically. The lag of HartfordData in uploading Hartford housing cases onto the platform creates a delay in the data visualized on the Hartford housing case heat map. To check the recency of the data visualized by the Hartford housing heat map, go to “data last updated” on the Socrata HartfordData website.
Conclusion
We hope that our research reviewing public data on Hartford housing code cases will support the Center for Leadership and Justice as they organize for a more transparent and just housing system. While large bodies of public data can often be challenging to construct meaning from, digital research tools and computer programming can be used to identify patterns in large data sets and present them in an engaging and accessible way.
Our research reveals that there have been nearly 30,000 housing code cases since 2011 and over 10,000 Hartford housing code cases have yet to be resolved. These findings raise serious concerns for community members facing unsafe housing conditions and housing justice advocates. Moreover, while the number of unresolved housing cases plummeted between 2015 and 2017, the proportion of cases unresolved rose by a factor of 4 between 2020 and 2021. These findings suggest that urgent action is needed to investigate and resolve housing code cases that are still open.
The Hartford Housing Code heat map can be used as a tool to identify which communities and buildings that have experienced housing code violations. This information not only contextualizes the unjust housing crisis in Hartford, but can be utilized by the Center for Leadership and Justice to provide targeted outreach to those most impacted by housing injustice.
With housing-related issues growing quickly and living conditions remaining unsafe, the CLJ’s recent efforts to develop and implement a more just housing code are particularly critical. Collaborating with the CLJ over the past three months has taught us the importance of creating social change from the ground up. In engaging those most impacted by housing code violations, the CLJ can build community power to create a more equitable and humane Hartford housing system for us all.
We would like to express our enormous gratitude to the Center for Leadership and Justice, especially Juan Fonseca. You have been a deeply inspiring and supportive community partner and we have learned so much from you and the rest of the CLJ team throughout this semester.
We would also like to extend our sincerest gratitude to Erica Crowley for her generous assistance and guidance every step of the way. Erica was incredibly helpful in teaching us the skills we needed to clean and organize the Hartford housing code public data. You have helped us grow as researchers, learners, and partners and we are so grateful!
Lastly, we are deeply grateful to Ilya Ilyankou for creating the Hartford housing code heat map and Professor Jack Dougherty for assisting us in understanding the data visualization.
