Visualizing Referral Trends with the CT Office of Early Childhood
Community Learning Research Fellow Alberlis Hernandez ‘23
with community partner Rachel Leventhal-Weiner, CT Office of Early Childhood
and faculty sponsor Prof. Elise Castillo
Spring 2022, Trinity College, Hartford CT
Problem: Connecticut Office of Early Childhood (OEC) supports families, providers, teachers, and other professionals who are raising or who work with young children. They collect data regarding the programs they offer and the families they serve. The data they collect and report is publicly available on their website, but it is difficult to understand and interpret data trends over time with its current format. This means that OEC can improve how they compile data in a way where it is most meaningful. There is a need for data visualization where OEC can use their data to actively drive decisions, specifically for their 2-1-1 and Child Development Infoline (CDI) referral services.
Research Questions:
1. What are meaningful ways to visualize trends in OEC’s 2-1-1 and CDI Infoline referral services?
2. How can such visualizations illustrate the impact the coronavirus pandemic had on the number of interactions these programs had with families?
Background:
Connecticut Office of Early Childhood (OEC) is a state agency that oversees a network of programs and services for families in Connecticut. These programs provide childcare licensing, work to prevent child abuse, offer training and resources to build parenting skills, and more. My research will focus on the data for 2-1-1 and CDI Infoline such as the count of referrals and services they offer yearly.
- 2-1-1 is a free, confidential referral Infoline for essential health and human services. OEC fulfills the Childcare Resource and Referral mandate and handles childcare referrals and requests for 2-1-1. As a result, they only collect data from this Infoline on the number of referrals requested which are grouped by the age for the childcare needed.
- The Help Me Grow campaign is a statewide outreach program designed to increase awareness for universal developmental screening via the Child Development Infoline (CDI). Similar to the 2-1-1 Infoline, families can reach CDI at 1-800-505-7000 and get their developmental questions answered. At this number, parents can also ask for referrals that are specific to child development. This helps connect children who are experiencing developmental challenges with childcare and health services that can support their needs.
- When families use CDI they can ask a provider to enroll in The Ages and Stages Questionnaires (ASQ-3). This is a way to track a child’s development from 5 months to 5 years of age using a developmental screening tool that is completed by a child’s caregiver(s) on paper, online, or through the Sparkler app.
Sources and Methods:
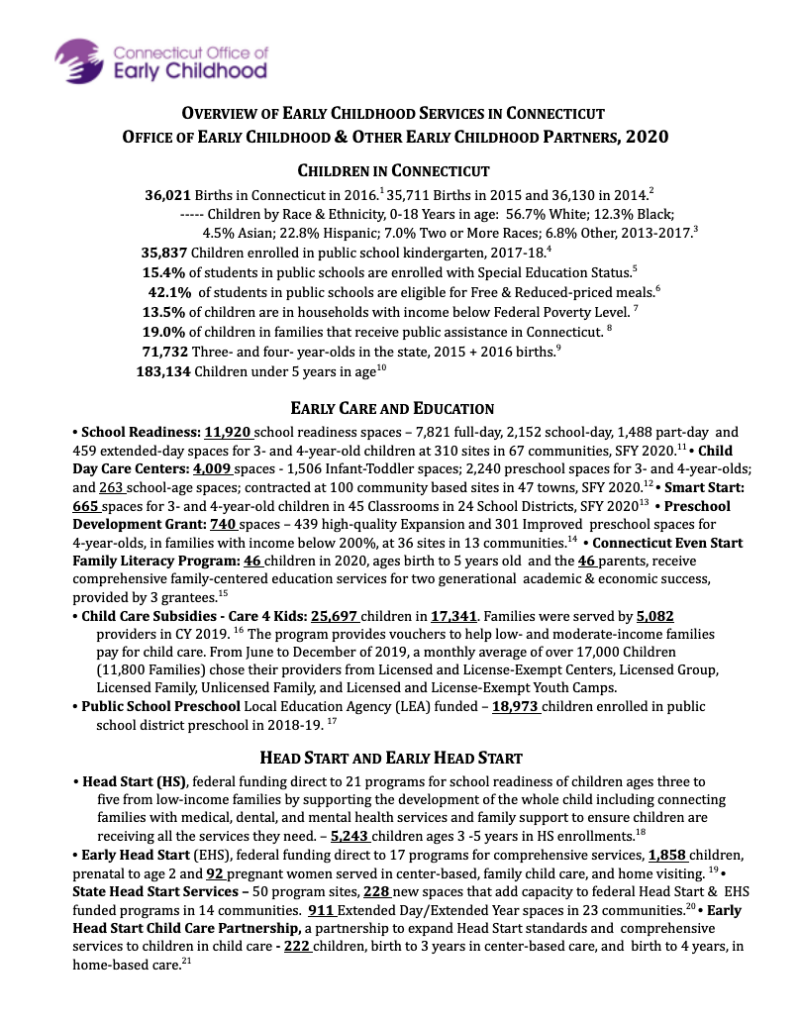
I used OEC’s at-a-glance data facts as my source of information. These are annual compilations of data that OEC publishes to provide a brief overview of their childhood services in Connecticut. Currently, these forms only offer data for the years 2014 to 2021. Figure 1 is a screenshot of the OEC at-a-glance datasheet for 2020.
Each OEC annual report illustrates two problems the agency faces.
- Initially, numerical data is presented primarily as text, which made it hard for readers to process.
- Additionally, the individual annual reports did not show data from prior years, which made it impossible to see long-term patterns.
Thus, the first challenge was to compile the data from the individual annual reports in order to visualize long-term trends. My community partner and I agreed to only use the “Information and Referral” section on these reports as my source of data. I made a Google spreadsheet to compile the data in one location, which you can see in Figure 2.
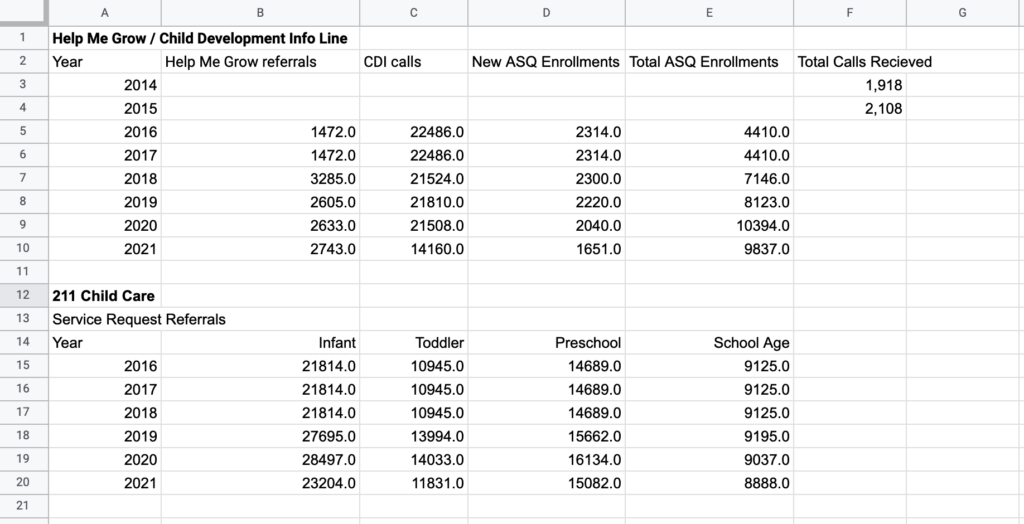
Having compiled data from different years, OEC staff and I discovered compatibility issues pertinent to the data collection. There were data points that remained constant through multiple years, thus we have possible data discrepancies. To visualize these issues and discover trends, I made line charts of 2-1-1 and CDI referrals and services.
Key Findings:
- In Chart 1, we saw a general increase in referrals for 2-1-1 Childcare until 2020. During the pandemic, there was a drop in referral calls for infants and toddlers. For all age groups, data points were constant from 2016 to 2018.
- In Chart 2 we see a decrease in Help Me Grow referrals pre-pandemic, followed by a consistent increase in referrals during the pandemic. The data points were also constant for the years 2016-2017.
- It appears total ASQ-3 enrollments increased each year until the pandemic occurred in Chart 4. Meanwhile, new ASQ-3 enrollments continued to decrease before and during the pandemic.
- Total calls CDI received lowered during the pandemic (Chart 3) yet we saw an increase in referrals that connect families to Help Me Grow services (Chart 2) for 2020-21. This would appear families are more interested in child development and behavior resources but ASQ-3 enrollments dropped (Chart 4) in the same time frame.
Total 2-1-1 Childcare Referral Requests:
To start off, I graphed the service request referrals for childcare that OEC handled for 2-1-1. Service requests are defined as an exchange of information between a family and a 2-1-1 Infoline provider. These calls are entered as referrals for childcare if the discussion topic pertains to anything related to childcare such as the kind of childcare options available or quality indicators, etc. From 2016 to 2018 the amount of service request referrals was constant, which made OEC staff and I question possible issues with data collection. It is unlikely the number of calls remained exactly the same for three consecutive years. To continue, we encounter a noticeable increase in referral calls for infants and toddlers from 2018 to 2020, which are years prior to the pandemic. Then there were drops in calls for the same groups in 2020, the year the coronavirus pandemic was declared. While referral calls for all child groups lowered by 2021, we can see that infant, toddler, and preschool children had numbers still higher than calls for 2016-2018.
Chart 1: Total 2-1-1 Childcare Referral Requests
This chart illustrates the number of 2-1-1 service request referrals for childcare grouped by the ages of the children of interest.
Total Help Me Grow Referrals:
Next, I graphed the total number of referrals that directed families to services by Help Me Grow providers. Help Me Grow providers help families with questions or concerns about a child’s development or behavior. In Chart 2, we see an increase between 2017 and 2018 of about 1,813 more referrals made. Here we also question what factors may have led to the increase or if there is a discrepancy in the data collection. After a decrease between 2018 and 2019, the total referrals increased by about 100 calls each year.
Chart 2: Help Me Grow Referrals
This chart shows the total number of referrals that direct families to services by Help Me Grow providers.
Total CDI Calls:
To continue, the next data I looked at was the total number of calls the Child Development Infoline (CDI) received each year. This total includes the calls for Help Me Grow and ASQ-3. CDI also helps pregnant women connect to pregnancy-related supports, such as WIC. This chart demonstrates a greater decline in calls from 2020 to 2021. This is the only program where families can also request information through fax or mail. However, phone calls are the only data that gets reported and are publicly available on OEC’s at-a-glance forms. It appears we have incomplete data and cannot make the conclusion that there was a drop in total interactions CDI received during the pandemic. What we are able to say from this chart is that families were less likely to use phone calls for assistance from CDI. It should also be highlighted that while CDI calls decreased during the pandemic, this contrasts with the increase in total Help Me Grow Referrals we saw in Chart 2. Thus, more information was wanted for child development and behavior over other information CDI can provide.
Chart 3: Total CDI Calls
This chart graphs the total number of calls the Child Development Infoline (CDI) has received each year.
Total and New ASQ-3 Enrollments:
Lastly, the “Information and Referral” section from OEC’s at-a-glance data facts also provides data on total and new ASQ-3 enrollments each year. In Chart 4 we see that the number of new enrollments has decreased since 2016, yet the total number has continuously increased by a couple hundred each year. Then, during the pandemic, we saw a decline in the total amount of ASQ-3 enrollments. These questionnaires are for families to self-track their child’s development and were created with the Help Me Grow campaign.
Chart 4: Total and New ASQ-3 Enrollments
The chart shows the amount of new The Ages and Stages Questionnaires (ASQ-3) enrollments by parents that year, and the total number of enrollments.
Recommendations for Next Steps:
- A next step that I would recommend is to try and normalize these trends with other sources of data that OEC may have available, like the total monthly referrals to OEC’s Birth to Three system. This step may help sort out discrepancies in the data like why calls to CDI were declining yet total Help Me Grow referrals have increased from 2020-21.
- These visualizations should be the starting point for understanding trends among the network of programs and services under OEC. They are important with regard to understanding what programs are being used most by parents and how they can be made more accessible. With consistency in visualizing trend data, we can watch for a rise or decline in interactions between families and OEC referral programs post-pandemic.
- I would recommend OEC track CDI requests by fax and mail in order to get more complete and accurate data.
Acknowledgments:
I would like to acknowledge Rachel Leventhal-Weiner, the Chief Research & Planning Officer at OEC. I would also like to acknowledge Jack Dougherty (Professor and Director of the Trinity College Educational Studies Program) and Dr. Elise Castillo (Assistant Professor of Educational Studies).